Port and logistics infrastructure affects a smaller exporter through how long ships and containers wait, which direct shipping services are within reach, how smoothly documents and border steps move, and how goods travel between factory, port and buyer; together these shape both freight costs and how reliably orders arrive. Judge a route by its ocean rate or a port’s ranking alone and the waiting that matters is easy to miss: inland legs, cut-off buffers, transshipment and import release, which later appear as missed sailings, extra stock or charges nobody priced in.
This explainer is for small and mid-sized firms shipping goods in sea containers. It gives no freight rates, schedules or port rankings, and does not cover customs law, Incoterms or insurance terms.
| Item | What it means | Source or condition |
|---|---|---|
| Port infrastructure | Berths, terminals and handling equipment, plus the road, rail and data links around them | Definition; the World Bank treats logistics as a network of services |
| Ship time in port | Time a container ship spends from arriving at anchorage or pilot station until it leaves the berth | CPPI methodology note, June 2026; port level, not door to door |
| Liner shipping connectivity | How well a country or port is linked to scheduled container services | UNCTAD LSCI; scheduled network, not a price |
| Container export dwell time | Days from a full export container reaching the port to its loading on the ship | World Bank LPI 2.0 definition; includes buffer time set by lines |
| Container import dwell time | Days from unloading at the destination port to leaving the port | World Bank LPI 2.0 core indicator; 2023–24 data |
| Border procedures | Documents, clearance and cooperation between agencies | OECD Trade Facilitation Indicators, 163 economies, 2025 edition |
| Reliability | How much journey times vary, not only their average | World Bank, 2026: delays least predictable when goods are stationary |
Where an export shipment spends its time
Time and cost build up at handovers, and the seaport is only one of them. The World Bank’s LPI 2.0 tracks several of these stages for containers, which makes it a useful map.
Before the box reaches the port, an indicator called export supply chain initiation runs from an empty container being sent to the exporter until the full container is taken in charge by the shipping line at the port or an inland facility. The World Bank says it reflects how efficiently shippers, consignees and trucking companies work together.
At the export port, container export dwell time runs from the full container’s arrival to its loading on the ship. The 2025 LPI 2.0 report notes that this includes buffer time, voluntary or required by shipping lines (it gives 48 hours before departure as an example), and that upstream paperwork such as certificates of origin is not automated in many economies and may hold containers back.
Then come the ship’s call, the ocean leg and often transshipment at a hub; LPI 2.0 counts both the number of transshipments and the time spent in them. At destination, container import dwell time runs from unloading to leaving the port, and reflects customs and border management, terminal operations, cargo removal practices, truck availability and infrastructure quality. Delivery to the buyer follows.

Takeaway: Map your route stage by stage before deciding which stage is slow or expensive.
Port efficiency, connectivity and dwell time are different clocks
The best-known indicators each measure a different part of the chain, and none of them measures what a shipment costs.
The Container Port Performance Index (CPPI), produced by the World Bank with S&P Global Market Intelligence, measures how long container ships spend in port, from arrival at anchorage or the pilot station until departure from the berth. It rates ports, not individual terminals, and scores from editions before 2024 were normalised within each year, so they cannot be compared across editions.
UNCTAD’s Liner Shipping Connectivity Index (LSCI) describes how well a country, or a port in the port-level version, is integrated into liner shipping networks. Its six components cover scheduled calls, deployed capacity, regular services, liner companies, largest ship size and countries reached by direct service. A service counts as direct even if it calls at other ports, provided the container is not transshipped.
The World Bank’s LPI 2.0 reports 21 indicators by economy, built mainly from shipment-tracking data for 2023–24, with no single country ranking. The report states that cost is not directly measured, though two indicators of competition among shipping services tend to be associated with lower logistics costs.
| Indicator | Measures | Does not tell you |
|---|---|---|
| CPPI | Container ships’ time in port, by port | Customs clearance, truck waits or door-to-door time |
| LSCI / port LSCI | Scheduled liner network links | Space on a sailing, punctuality or freight rates |
| LPI 2.0 | Tracked connectivity and container times, by economy | Cost, or the time for one firm’s shipment |
| Your quotes and shipment records | What your route included, cost and took | How the wider network performs |
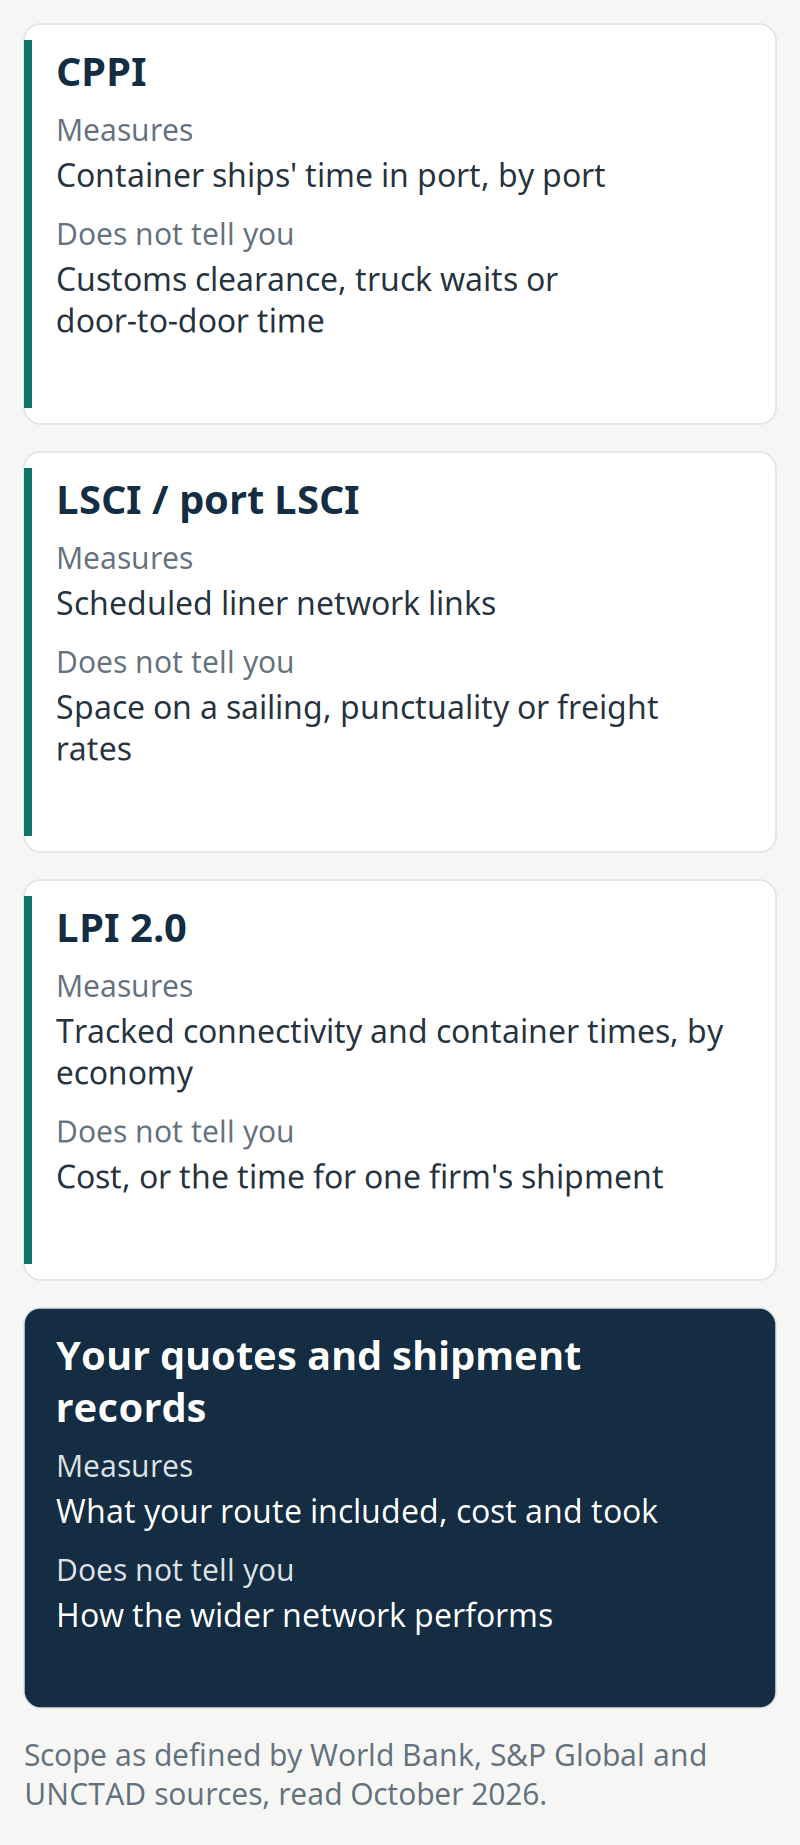
Common mistake: Reading a strong CPPI result as fast customs clearance, or a high LSCI as cheap or punctual freight. CPPI stops when the ship leaves the berth; LSCI counts scheduled services, not delivered ones.
Takeaway: Use each index for the question it answers, and use your own quotes and records for cost and timing.
Why smaller exporters feel it more
Firms using the same port share some constraints, but not all: a port can have several terminals with different operators and productivity. Some costs also fall unevenly. The WTO’s World Trade Report 2015 notes that fixed costs of entering a foreign market weigh particularly on the profits of small firms, which partly explains why small and medium-sized enterprises account for a relatively small share of international trade. Firm-level studies it reviews suggest that easier border procedures benefit not only large firms.
Unpredictability is the second channel. The World Bank finds delays are least predictable when goods are stationary, in ports and transshipment facilities, and more so for imports than exports. It says unpredictability disrupts production planning, increases inventory needs and weakens competitiveness in just-in-time and perishable goods markets, and that for firms in global value chains predictability is often as important as speed. A firm shipping a few containers a year may have less room to absorb a missed connection, though no source we reviewed measures this. How factories plan around uncertain inputs is covered in What Digital Manufacturing Means on the Factory Floor.
Connectivity matters too: the World Bank finds more connected economies reach more partners directly and tend to face lower trade costs, an association rather than a guarantee for any route.
One older study put a number on port efficiency. Clark, Dollar and Micco (NBER, 2004) estimated that moving from the 25th to the 75th percentile of port efficiency reduced shipping costs by 12%, using US import data from 1996, 1998 and 2000 and port-to-port charges. It is a historical estimate, not a forecast for any port today.
Takeaway: Fixed costs can weigh more on small firms’ profits, as the WTO notes; that delays may also hurt them more is our inference, not a measured finding.
What a smaller exporter can check on a specific route
A firm cannot speed up a terminal, but it can compare routes on the same terms and find out what each stage includes. US trade guidance describes international freight forwarders as agents for exporters that can move cargo “dock-to-door”, arranging transport, documents, cargo space, consolidation and insurance.
| What to ask | Why it matters |
|---|---|
| Are all quotes for the same origin, destination, cargo and volume? | Otherwise they are not comparable |
| Which stages are included, from pickup to delivery, including destination charges? | A base ocean rate can leave stages out |
| Is the service direct, or transshipped, and where? | Transshipment adds a stationary stage where delays are hard to predict |
| What is the cut-off before sailing? | Export dwell includes buffer time set by lines |
| Which documents are needed, and who prepares them? | Upstream paperwork can hold containers back |
| Is consolidation available for a part load? | It may suit small volumes; cost and speed vary by route |
| How is the shipment tracked, and who handles exceptions? | Visibility helps firms manage some unreliability |
| Is cargo insurance included, and on what terms? | Coverage should be confirmed, not assumed |
Common mistake: Choosing on the ocean rate alone, when inland legs, destination charges or a missed sailing can outweigh the difference.
Who arranges freight often depends on the sales route; How Small Manufacturers Build International Sales Channels explains how agents, distributors and intermediaries divide that work.
Takeaway: Ask every forwarder the same questions about the same shipment, and keep the answers with the quote.
What public policy can change
Some causes of cost and delay sit with governments and port authorities. The OECD’s Trade Facilitation Indicators, which monitor border procedures in 163 economies, found progress in every region since 2022, with cooperation between domestic and cross-border agencies the leading area. Gaps remain between legal frameworks and practice, especially in automating documents and procedures. The World Bank groups policy priorities into connectivity, time and variability, and institutions.
Takeaway: Firms can follow these reforms and adjust routes as they take effect, but they cannot substitute for them.
Where this does not hold
- Landlocked origins or destinations. The World Bank finds landlocked developing countries face some of the longest and least predictable import times, with delays at ports, borders and inland checkpoints; road or rail corridors can matter more than the seaport.
- Investment does not guarantee a lower price. No source we reviewed shows that new berths, cranes or automation pass through to lower charges on a given shipment; that depends on competition, demand and contracts.
- Direct is not always better. A direct service removes a transshipment stage, but frequency, space and inland distance still need checking.
- Long dwell is not always congestion. Export dwell includes line buffer time and document waits.
- Indices describe the past. LPI 2.0 uses 2023–24 data; a country or port score is not a quote.
- Road and rail are only partly covered. LPI 2.0 has no global road or rail data source, though container tracking along corridors includes some road transport.
Takeaway: Treat infrastructure as context for a route decision, not a substitute for checking the route.
How we researched this
We used World Bank reports and methodology notes on the LPI and CPPI, UNCTAD’s connectivity definitions, OECD, WTO and NBER research and US trade guidance, read in October 2026. We could not obtain the full text of UNCTAD’s Review of Maritime Transport 2025, so it is not used, and we quote no index values, rankings or freight rates. More on our approach is in our editorial policy; further context on infrastructure and trade is in World.
Takeaway: Public indicators are dated context; your own quotes and records are the evidence for a route.