Spare parts inventory is the maintenance, repair, and operations (MRO) stock of repairable and consumable parts held after initial equipment provisioning so facility infrastructure and production machinery stay in working order. Across spare-parts classification case studies reviewed by researchers at the University of Portsmouth, the most commonly employed classification criteria are replenishment lead time and part criticality, followed by annual cost usage and unit price.
Critical parts kept in inventory at all times include parts for safety and emergency situations and parts for equipment that uses obsolete components, including an unwarned safety, health, or environmental hazard. Long lead items needed for safe, dependable, and effective operation can be purchased concurrently with the production machine, while other parts replenish at a reorder point that covers demand during the supplier lead time. Companion explainers on factory operations and equipment reliability appear in our Industry section.
How Do Criticality and Lead Time Classify Spare Parts Inventory?
Classical ABC inventory control sorts items into A, B, and C tiers using annual cost usage alone, calculated as unit cost multiplied by demand volume. As the University of Portsmouth operations-research review notes, a single spend figure misses failure severity and supplier wait time: an inexpensive sensor, valve, or custom coupling with low annual usage falls into class C by spend yet halts a line for weeks if no replacement sits in the crib.
Engineering spare lists start instead from Failure Modes and Effects Analysis (FMEA) and logistical constraints, as specified in the commissioning checklist of NASA’s September 2008 Reliability-Centered Maintenance (RCM) Guide. Table 4-1 of the NASA guide quantifies how important a system function is to the facility mission across 10 categories of criticality and severity, allowing a plant to expand or contract those categories into a site-specific listing:
- Rank 1 (None) applies when failure has no expected effect on safety, health, the environment, or the mission.
- Rank 7 (High) applies when failure causes high disruption to facility function, some portion of the mission is lost, and a significant delay in restoring function.
- Rank 10 (Hazard) applies when failure creates a potential safety, health, or environmental issue and occurs without warning.
Department of Defense Manual DoDM 4151.25 (dated February 16, 2024) groups failure consequences into four operational domains: safety involving injury or death, environmental breaches of a law, regulation, or standard, mission effects that harm capability or force an abort, and economics where the mission is unaffected and only repair and operating costs apply. DoDM 4151.25 categorizes hidden failures separately from failures evident to equipment operators, and the consequences of failure must be used to judge whether a maintenance task reduces the risk of failure to an acceptable level. The U.S. Navy readiness-based sparing instruction sets repair-part allowances so prescribed readiness thresholds are met at the lowest possible cost, expressed as operational availability, a full mission-capable rate, a mission-capable rate, or a combination of those measures.
Crossing those consequence classes with the recorded supplier lead time separates parts kept in inventory at all times from parts ordered at a reorder point or bought with the lead time predictive maintenance provides.
| Failure consequence or part class | Operational and lead-time exposure | Storeroom stocking and procurement rule |
|---|---|---|
| Unwarned safety, health, or environmental hazard (NASA Rank 10; DoDM 4151.25 safety or environment) | The failure will occur without warning | Keep the part in inventory at all times when it is designated for a safety or emergency situation, and replenishment parts may be acquired concurrently with production of the end item |
| Hidden failure (DoDM 4151.25) | The failure is not evident to the equipment operator | Categorize hidden failures separately from failures evident to equipment operators |
| Parts for equipment that uses obsolete parts (UW System MRO critical-parts policy) | The equipment still uses obsolete parts | Keep those parts in inventory at all times |
| High disruption (NASA Rank 7; DoDM 4151.25 mission) | High disruption to facility function, some portion of the mission is lost, and there is a significant delay in restoring function | Place the replenishment order at the reorder point, hold safety stock as the difference between that reorder point and expected lead-time demand, and where a readiness threshold governs the allowance set that allowance at the lowest possible cost |
| No mission effect (NASA Rank 1; DoDM 4151.25 economics) | No reason to expect an effect on safety, health, environment, or mission, with only economic considerations remaining | Where equipment is expected to run to failure, a large material inventory of repair parts is required, while predictive maintenance provides some lead time to purchase materials for the repairs and reduces the need for a high parts inventory |
If a plant runs equipment to failure as its default practice, the U.S. Department of Energy (DOE) Operations & Maintenance Best Practices Guide notes that a large material inventory of repair parts is required. The rows below keep that consequence class next to the lead-time decision.

How Do You Calculate Reorder Points and Safety Stock?
Once a spare part is assigned to demand-driven replenishment rather than continuous fixed retention, the reorder point sets the on-hand and on-order inventory position that triggers a purchase order. Under the stochastic inventory formulation published by the University of Texas at Austin, replenishment lead time L is the wait between placing that order and receiving the shipment. Whenever actual demand during L exceeds the reorder point, a shortage occurs. Safety stock is the added inventory buffer held against lead-time demand uncertainty, defined as the difference between the reorder point and expected lead-time demand.
For spare parts consumed independently in single units at an average rate D per time interval over a lead time L expressed in the same time unit, lead-time demand follows a Poisson distribution:
Expected lead-time demand = D × L
Poisson standard deviation = square root of (D × L)
Reorder point = (D × L) + safety stock
When expected lead-time demand exceeds 30 units, exact Poisson tail probabilities become cumbersome to evaluate directly. In that regime, the University of Texas notes apply a Normal distribution approximation with mean D × L and set its standard deviation equal to the square root of that mean.
Example calculation (using the University of Texas one-week lead-time case): Suppose a storeroom item experiences an average demand of 100 units during a one-week replenishment lead time. Taking the standard deviation as the square root of the mean gives a standard deviation of 10 units (since the square root of 100 equals 10). In the cost-optimizing solution presented in the notes, safety stock is about 13 units above the 100-unit expected lead-time demand, paired with an order quantity of 245 units and a cycle stockout risk of 0.103. Those optimum figures belong to that specific cost parametrization; each plant sets its safety stock against the downtime consequence of the equipment served.
Why Intermittent Spare Demand Breaks Ordinary Smoothing
Many production-line spares sit untouched across multiple review periods and then experience sporadic withdrawals. Research reviewed in George Washington University’s working paper on intermittent demand highlights why standard forecasting formulas misfire on slow-moving spares: when batch replenishment is triggered right after a demand event occurs in the most recent interval, ordinary single exponential smoothing over-estimates mean demand and under-estimates variance, producing inappropriate stock levels.
To correct that structural distortion, Croston’s 1972 formulation (with Rao’s 1973 corrections) splits intermittent demand into two separate exponential smoothing equations, updating expected order size in one stream and the time gap between orders in a second stream under the assumption that order size and inter-arrival timing are independent. Planners implementing intermittent-demand software should also verify which estimator variant their system runs, because Syntetos and Boylan proved in 2001 that the original Croston estimators are mathematically biased.
The monthly book-to-shelf check is the count that follows the reorder calculation. The DOE FEMP guide treats an accurate accounting of spare parts as an element of cost control, and a monthly reconciliation of inventory on the books and on the shelves can measure that control.

When Should Long Lead Items Be Bought With the Machine?
Acquisition lead time, as defined in U.S. Government Accountability Office report GAO-11-240R, is the buyer’s estimate of when an ordered item will arrive from a supplier, governing material availability, inventory sizing, and capital budgeting alike. Errors in that supplier wait estimate punish operations from opposite directions. In fiscal year 2005, as documented by GAO-11-240R, the Army underestimated lead times, the Defense Logistics Agency overestimated lead times, and the Air Force and Navy both overestimated and underestimated lead times: underestimates put almost 12 billion in spare parts more than 90 days later than anticipated, and overestimated lead times caused 2 billion to be obligated more than 90 days earlier than necessary.
On a production line, that late arrival is a stockout while the repair waits, and that early obligation commits working capital before the part is needed. The backup-seller check is whether that second name shares the processor. As detailed in our guide to assessing supply chain concentration risk in manufacturing, adding a second commercial distributor that relies on the same upstream processor still causes downtime when that shared processor stops.
For custom or safety-essential long lead items, the replenishment buy can ride with production of the end item. Under DFARS 217.7501, replenishment parts encompass repairable or consumable parts acquired after initial provisioning, and DFARS 217.7502 establishes two procurement rules that map directly to industrial capital equipment projects:
- Concurrent acquisition: Buyers may acquire replenishment parts concurrently with production of the end item so long-lead spares ride the original equipment build schedule.
- Qualified-source restriction: Replenishment parts must be acquired to ensure the safe, dependable, and effective operation of the equipment; where new sources cannot provide that assurance, procurement may be restricted to the original equipment manufacturer or to sources that have previously manufactured or furnished the parts, when justified.
| Replenishment exposure | Operational or working-capital consequence | Procurement and engineering control |
|---|---|---|
| Underestimated supplier lead time (GAO-11-240R) | Almost 12 billion in spare parts arrived more than 90 days later than anticipated | The lead-time estimate is the date the buyer expected the supplier to deliver |
| Overestimated supplier lead time (GAO-11-240R) | Overestimated lead times caused 2 billion to be obligated more than 90 days earlier than necessary | Use the expected supplier receipt date as the lead time in the inventory and budget calculation |
| Unproven aftermarket source on a critical part (DFARS 217.7502(b)(2)) | Substitute component lacks documented assurance of safe, dependable, and effective machine operation | Restrict sourcing to the original equipment manufacturer or previously qualified producers until technical qualification is complete |
| Dual distributors sharing one upstream processor | Both purchase orders stall simultaneously when the shared fabrication or processing facility stops | Confirm the physical production site behind each seller before reducing on-hand safety stock |

When Does Predictive Maintenance Reduce Spare Parts Stock?
Maintenance strategy directly alters how much inventory the storeroom has to carry. Where equipment is expected to run to failure, a large material inventory of repair parts is required, while predictive maintenance provides some lead time to purchase materials for the repairs and reduces the need for a high parts inventory. NASA’s RCM guide similarly ties equipment maintenance history to failure forecasting, which in turn adjusts spare-part stock levels.
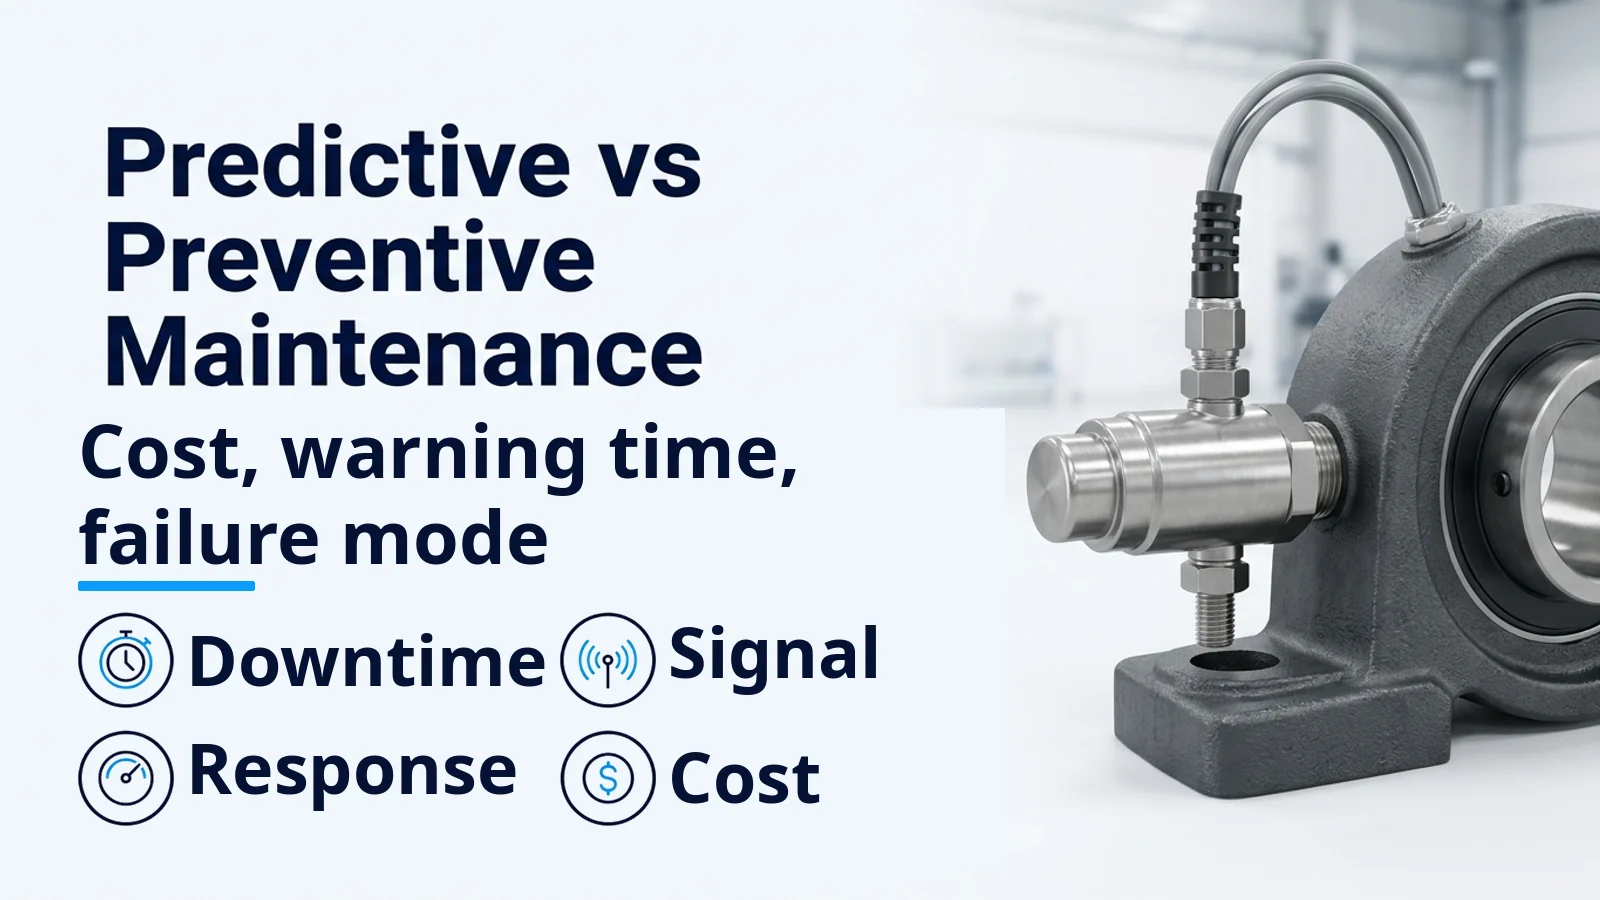
The smaller on-hand inventory depends on that warning. As examined in predictive vs preventive maintenance: the machine-level cost decision, condition monitoring earns its cost only when a useful warning reaches a maintenance team that can act in time. Where that warning does not reach the team in time, the need for a high parts inventory remains.
The guide’s filter example shows that path inside the CMMS. Complete parts and materials inventory control with automated reorder capability is a listed CMMS function in the DOE FEMP guide: a condition-based filter change can become a CMMS work order, and that filter item is then removed from inventory and a reorder is placed if necessary.

How Do You Measure Storeroom Turnover Without Cutting Critical Spares?
Finance teams frequently track inventory turns to spot bloated MRO cribs, yet applying a single plant-wide turnover target across every bin pressures storeroom managers to liquidate slow-moving safety spares and irreplaceable parts for legacy machines. Under the University of Wisconsin System MRO Inventory Policy, each facility defines critical parts and emergency purchases according to its own operational and reporting requirements, and removes critical parts, including safety items, emergency stock, and parts for equipment using obsolete components, from the turnover calculation altogether:
MRO inventory turnover (excluding critical parts) = (Beginning counts excluding critical parts + Period purchase counts including one-time purchases − Ending counts excluding critical parts) ÷ Average of beginning and ending counts excluding critical parts
Pair that non-critical turnover ratio with a direct service metric and monthly shelf reconciliation so inventory discipline never masks storeroom shortages:
- Stock-out rate (UW System sample measure) = Number of stock-out occurrences ÷ Total pieces picked.
- Monthly book-to-shelf reconciliation (DOE FEMP guide): A monthly reconciliation of inventory on the books and on the shelves can measure cost control.
In a 1994 survey of 558 companies using a computerized maintenance management system, conducted by A.T. Kearney and Industry Week and cited via DPSI 1994 in the DOE FEMP guide, respondents reported an average 17.8% reduction in MRO inventory. Use that survey figure as historical context rather than a plant quota, keep designated critical parts out of the turnover ratio, and review failure consequences in NASA’s RCM guide, Department of Defense Manual DoDM 4151.25 (February 16, 2024), and the U.S. Navy readiness-based sparing instruction.